No time? Here's the short story
Introduction
My previous blog post offered a high-level glance into the loan descriptions at kiva.org. For my final project at the Metis Data Science Bootcamp, I delved a bit deeper in the micro-finance mechanics at Kiva, looking for a practical problem to solve. Earlier research papers on Kiva have studied for example how images of Kiva borrowers influence loan decisions by lenders [1], or which factors motivate lenders to make additional loans [2]. My high-level aim in this project was double: produce new insights, and, above all, build something ready to use and demo — all in the course of four weeks.
Let's start by setting the stage.
The micro-finance process at Kiva.org
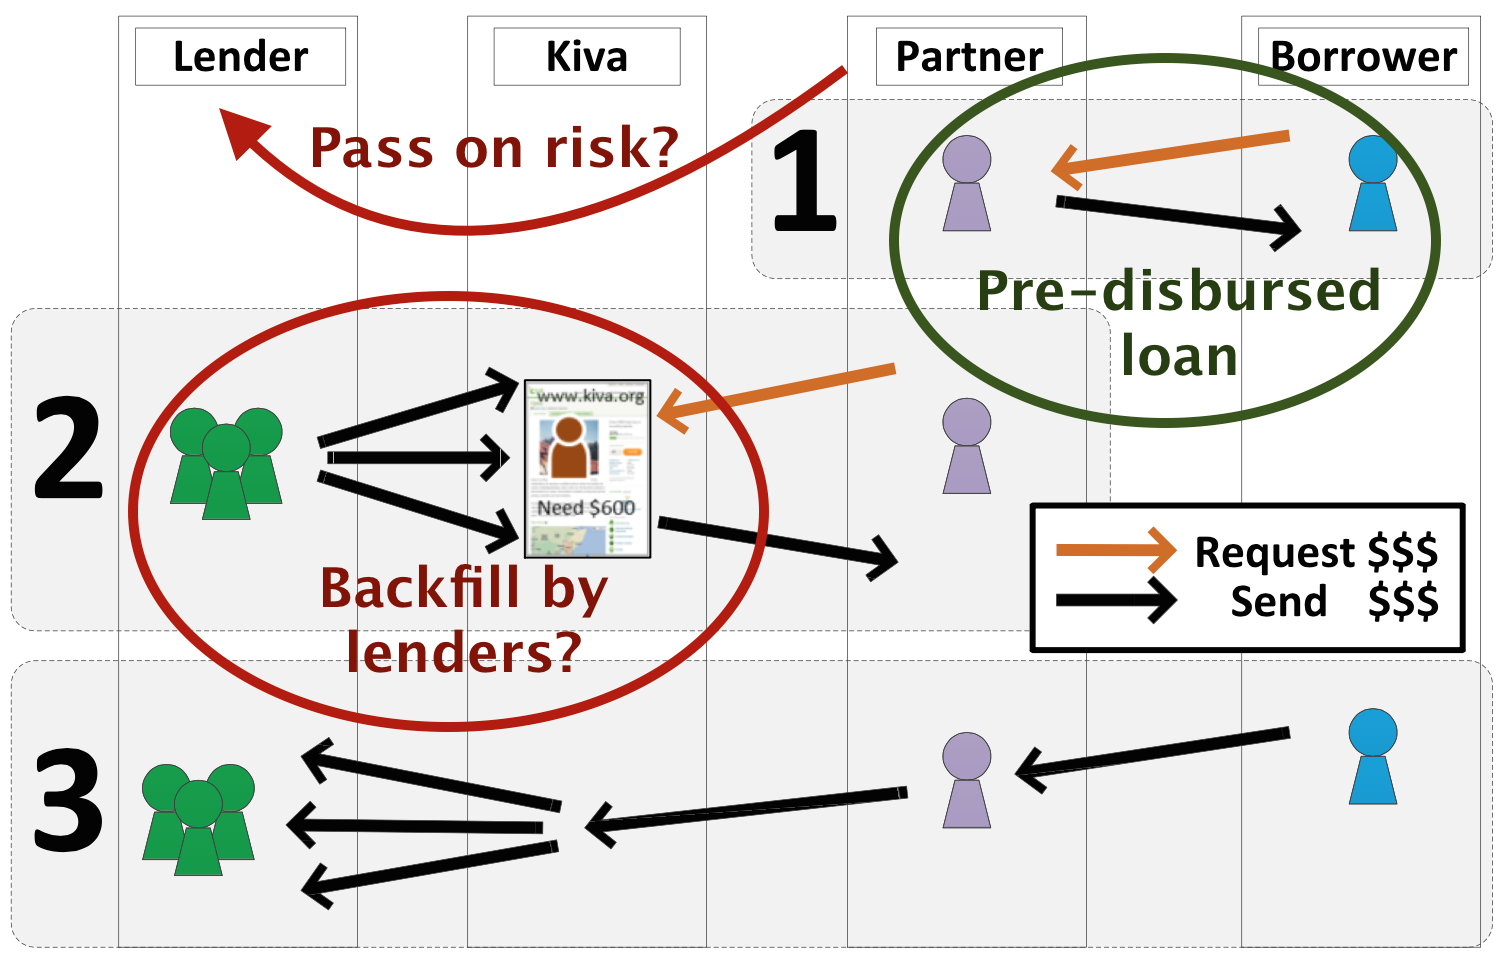
The abovementioned paper [2] contains a clear overview of the Kiva loan process. It is repeated here below, but with a couple of additions (two ovals and one curved arrow) to point out some particulars that drew my attention:
- Field partners actually predisburse loans to borrowers before they are published to lenders on the Kiva website. This obviously involves a certain risk.
- So, when (typically an ad hoc group of) lenders allocate their money to a loan, they are actually back-filling a predisbursed loan. Only when a loan is fully backfilled does the loan default risk move from the field partner to the lenders.
 </img>
The crucial point, of course, is whether enough lenders will be found within a loan request's expiration time to back-fill the loan. When a loan is not completely funded in time, the allocated amounts return to the Kiva lenders, and the full risk stays with the field partner. The predisbursed loan itself, however, remains: the borrower already received the money, and is expected to pay it back over time.
Getting loans fully funded is in the interest of multiple parties:
- Even though field partners must have some capital of their own, they want to limit their overall risk by having the worldwide Kiva lender community maximally back-fill the predisbursed loans.
- Kiva lenders — who are benevolent by definition — want to see their available capital used, rather than stay dormant in the system.
- Borrowers will have an easier time getting loans predisbursed as the fields partners are more confident that they will be backfilled in time.
Efficient loan funding is therefore beneficial to the Kiva ecosystem as a whole. This is especially true in times when the total amount of loan requests exceeds the available money in the system.
By the way, Kiva loans being interest free, there is no other built-in mechanism for steering offer and demand, than trust, benevolence and advertizing — whether by word of mouth or otherwise.
The downside of Kiva's growth: non-backfilled loans
In terms of growth, Kiva has been a phenomenal success. Since its start in 2005, the number of loan requests has risen year after year. In the early years, there seems to have been enough available money in the system to fully backfill most, if not all loan requests. However, since 2012, a significant number of predisbursed loans do not get backfilled, as is illustrated below.
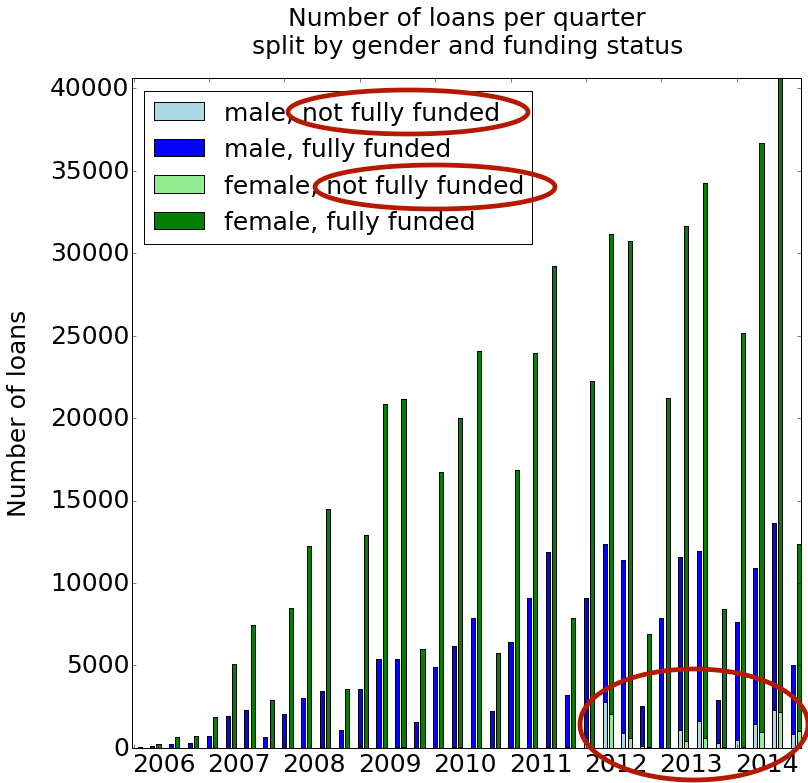
The rising number of non-backfilled loans since 2012 may be due to the relative lack of fresh inflowing capital from Kiva lenders, and/or to an intrinsic deterioration of loan quality. Whichever the reason, it is unknown if, to what extent and how soon the rising proportion of non-backfilled loans has translated into a growing reticence for field partners to predisburse loans in the first place: no data are currently available to test either of these hypotheses. But from the field partners' perspective, there must be an inherent limit to increase their own capital and incur more risk. In a system with acceptable risk-taking, any transgression of this limit must eventually hamper the (invisible) predisbursal rate of initial loan requests, including valid ones.
Especially male borrowers are lagging behind. Not only have they historically entered the Kiva system less frequently than females; but since 2012, loans to male borrowers have proportionally had a harder time getting backfilled than loans predisbursed to females.
Irrespective of the amount of money present in the Kiva ecosystem at any moment, we should at least try to make the available funds flow as efficiently as possible.
Kiva micro-finance is big
As a final introductory note, let's visualize how (much) money flows through the global Kiva ecosystem. The interactive Sankey diagram below summarizes, for the period 2012 through 2014, the money flows between lenders and borrowers. In these three years, more than 321 million dollars have been lent — and then (hopefully) repaid.
The connections in the center "column" show the country-to-country money flows. The left and right column do not really represent flows; they rather group the countries by region, respectively from the lenders' and the borrowers' perspective.
To see the dollar amounts, simply hover with the mouse over the graph. After a second or two, a popup will appear.
Kiva microloans, grouped per region and country
(2012-2014, combined)
All figures are calculated from a Kiva JSON data snapshot downloaded on February 17, 2015. The software code is available on GitHub.
Now that the stage is set, let's define our problem more precisely.
Business goal: optimal money flow, by predicting the funding of new loan requests
The business goal in this project is to reduce the amount of non-productive, sleeping money in the system.
The main observation is that it is better for X% of loans to be 100% funded, than for 100% of loans to be funded at X% each. In the latter (granted, somewhat extreme) case, following Kiva policy, all funds would simply return to the lenders. This means that not a single loan would be backfilled!
To reach this business goal, I propose a tool that provides an a priori insight into the chance of a loan request being fully funded by available Kiva lender money. Next to that, this study aims to uncover actionable insights to the concerned parties, who may benefit as follows:
- Field partners and borrowers can work together to adapt certain characteristics of a loan request in order to increase its chance of being funded.
- Field partners and/or the Kiva platform can promote certain loan requests, in the interest of system efficiency. This way they can avoid or mitigate the "many loans almost funded" trap.
- Lenders may want to know up-front if their money is going to fund a "winning" loan request, and adapt their decisions accordingly.
Disclaimer: I am fully aware that each of these uses are possibly controversial. They might indeed carry unintended side-effects, such as information asymmetry, perceived or real favoritism, and, in the worst case, intentional misrepresentation of loan characteristics. Since trust and transparency are key values for Kiva — or any other finance system, for that matter — any potential deployment into a global production setting should only happen after careful analysis of the risks and benefits involved. In the framework of this 4-week final project, I make no further statements about this important question. By the way, and for the record: Kiva.org was not informed about this project before it was completed and published here.
Solution architecture
My technical solution consists of 4 main components:
- Web services offered by kiva.org, for offline and online data retrieval
- An offline process for training and evaluating the predictor
- A live predictor, deployed in the cloud
- A web browser (Google Chrome) with a self-developed extension that virtually integrates all solution elements
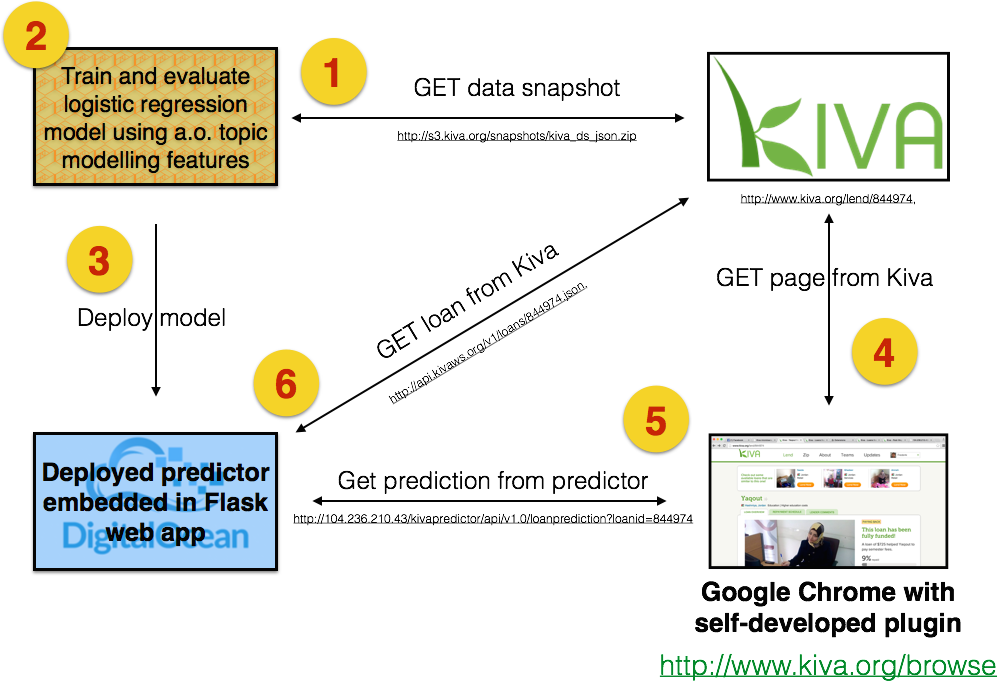
I now elaborate on each component, following the steps (1-6) in which they come into play. This description is somewhat idealistic, in that the real-life R&D process was more of an agile and iterative nature.
All code is available on GitHub. Steps 1 and 2 were run from an iPython notebook.
Step 1: Data Preparation
| Technology | Used for | Useful for |
|---|---|---|
| MongoDB | Local storage of documents/objects in the Kiva JSON snapshot | Selection of loans from specific years |
| langid.py | Language identification of Kiva loan descriptions | Correcting erroneous language identification by Kiva, due to mixed original versions and their translations |
| Pandas and numpy | Efficient storage of (mostly numeric) data points | Training and test data for supervised learning |
| Matplotlib | Plotting data | Producing the loan bar chart, split per gender and quarter (see above), and feature polarity graphs (see below) |
| gensim | Conversion of loan descriptions to a bag-of-words representation | Formatting these data in Blei Corpus Format, readable by SLDA (see below) |
| SLDA (Supervised Latent Dirichlet Allocation) | Training and evaluation of an auxiliary topic model | Reduction of 1000-dimensional bag-of-words vectors from the loan descriptions to 20 features (distribution over topics) |
In preparation of a previous project, I had already downloaded a Kiva snapshot of approximately 775.000 loans and their respective lenders on February 17, 2015. The data are reused in this project.
Step 2: Predictor/classifier training and evaluation
| Technology | Used for | Useful for |
|---|---|---|
| Scikit-learn | Training and evaluating a logistic regression model | Producing predictions and (rankable) prediction scores between 0-1 |
| pickle | Serialization of the trained model | Deployment to the live web app |
Feature creation
Three types of input features were extracted and/or derived from the JSON snapshot:
- 19 loan features extracted from the JSON representation of a Kiva loan
- 20 topic model features inferred for each loan from a Supervised Latent Dirichlet Allocation model that I created on the side
- 4 partner features extracted from the JSON representation of the Kiva partner list
The to-be-predicted label is defined as follows: divide the actual "funded_amount" by the requested "loan_amount". If this ratio is greater than or equal to 1, the loan is fully funded (label 1). If not, the loan is not fully funded (label 0).
The data set consists of all usable loans from the years 2012 through 2014: 21 K negative and 420 K positive instances. This a priori 20/1 ratio calls for careful class weight settings during model training.
Model training
From the outset, it was my plan to fit a logistic regression model against the training data, using 10-fold cross validation. The chosen class weight setting is 'auto', which should compensate for the strong predicted label imbalance in the training set. I also included some experimentation with varying regularization parameters. Since my prime goal in this project is to deliver an end-to-end system, rather than only an optimally trained "supermodel", I did not try out any other algorithm here. This pragmatic choice helped us maintain focus throughout the project.

Incremental feature contribution to model performance
As evaluation metric, I chose the ROC area under the curve. To detect the most informative feature groups, I started, in a 10-fold cross validation setting, from an information-less baseline model with 50% ROC AUC performance. I then tested each of the remaining feature groups independently, selecting the best one as the "constant" feature group for the next round. There, it was on its turn combined with each of the remaining feature groups; again, a winner was selected and added to the ranked list of feature groups. The end result of this iterative process is the following feature group ranking, in descending order of marginal contribution:
| Type | Feature group | ROC AUC | Percentage point improvement |
|---|---|---|---|
| — | Baseline | 50.00 % | — |
| Loan | Log10LoanAmount | 76,50 % | + 26.50 |
| SDLA | 20 loan description topics | 80.72 % | + 4.22 |
| Loan | PostedMonth[Jan..Dec] | 83.55 % | + 2.83 |
| Loan | MajorityGender | 85.99 % | + 2.44 |
| Loan | Log10NumberOfBorrowers | 87.13 % | + 1.14 |
| Partner | LoansPosted & TotalAmountRaised | 87.42 % | + 0.29 |
| Loan | GeoLongitude & GeoLatitude | 87.63 % | + 0.21 |
| Loan | RepaymentTerm | 87.77 % | + 0.14 |
| Partner | DelinquencyRate & Rating | 87.77 % | + 0.00 |
| Loan | BonusCreditElegibility | 87.82 % | + 0.05 |
A few observations:
- The mere combination of the four best feature groups already achieves 85.99% of ROC AUC. The additional six feature groups add less than 3 percentage points.
- Given the abovementioned difference between male and female borrowers, we expected gender of the borrower — or, more generally and precisely, of the majority of borrowers — to be among the most informative features. This is confirmed, but it is somewhat surprising that the 20-dimensional semantic contents of the loan description is even more informative. A plausible explanation is that gender is partially encoded in various implicit and explicit ways in the loan description. Check for yourself, as an example, in this female and male loan description for explicit gender-specific clues like pronouns. The implicit ones may be hidden inside particular types of gender-specific activities or textual clues (not further mined in this project).
- The month in which a loan request is posted is also highly informative. This was already apparent from the histogram above, where the second and third quarter of each year show a spike in loan requests, which has an impact on the backfill ratio.
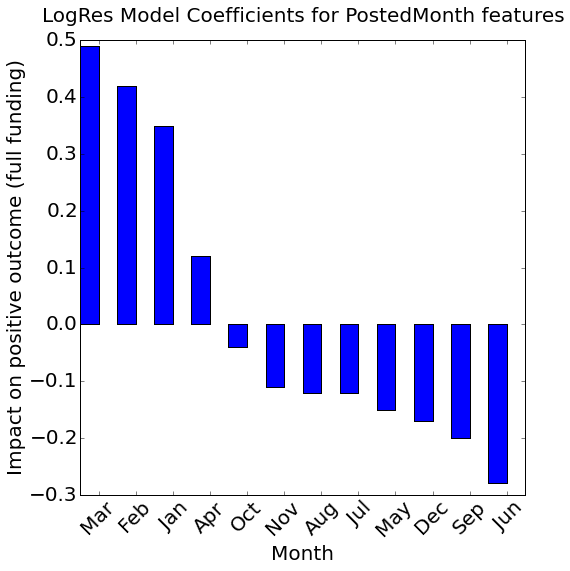
Also of interest is the feature polarity, i.e. whether a feature influences a positive prediction (= full funding) in the positive or negative sense. Let's look successively at the "PostedMonth" features, the topic features, and all the other ones.
What is the optimal time of year to post a loan?
All other things being equal, it is easier to get loans fully funded that are posted in the first three months of the calendar year. September and June are the least advantageous.
What is the impact of the topics found in the loan descriptions?
Twelve topics contribute positively towards full funding, the remaining eight negatively. The extent to which a specific loan description contributes in either direction, of course also depends of on the actual distribution of topics found in that particular document.
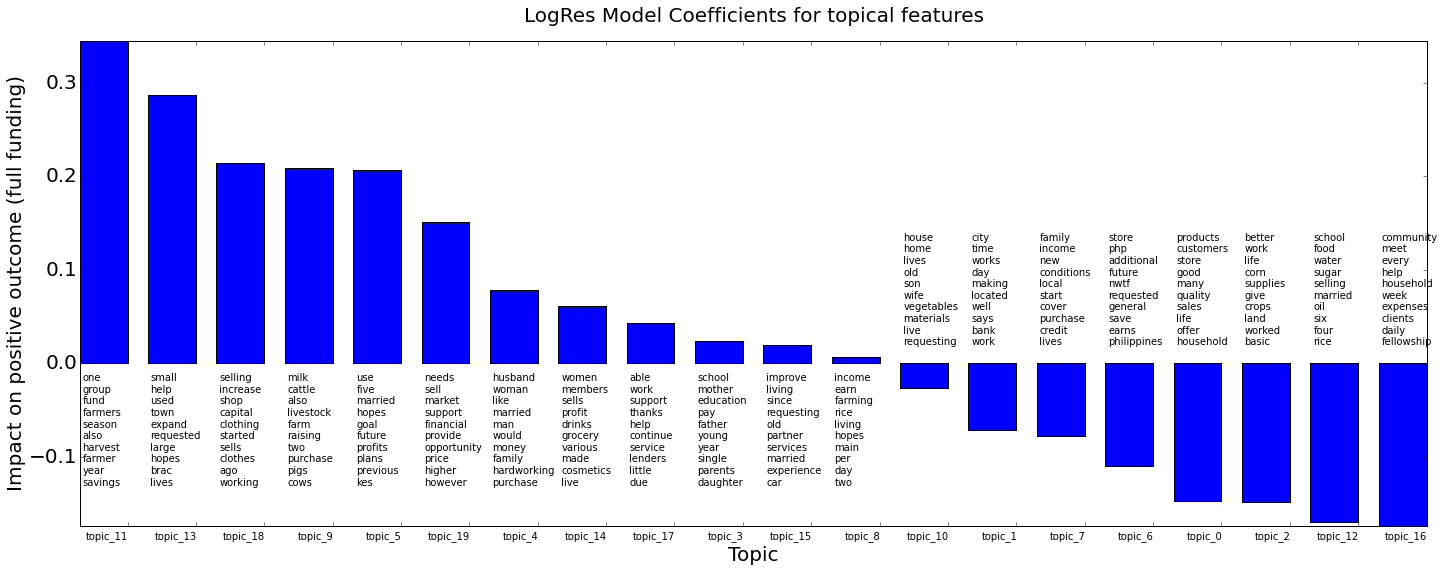
Each topic is represented here by its ten most prominent words.
And what about the other features?
A positive contributor to full funding is the total amount of money raised by the field partner: this can be interpreted as a proxy for the partner's longevity and reliability. On the other hand, the number of loans (LoansPosted) that went through that same field partner's hands negatively impacts full funding - strangely so.
The more borrowers take part in a loan request, the better its chanches to get fully funded. This can be interpreted as a form of risk reduction, the idea being that multiple borrowers will help and/or control each other, thereby increasing loan quality. Otherwise said: lenders tend to appreciate and foster collaboration between borrowers - with their money.
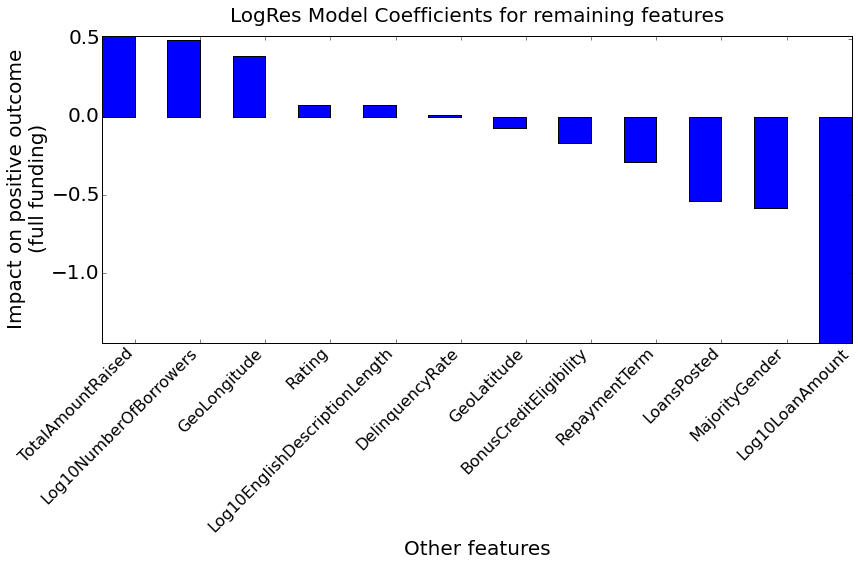
In my system, gender is encoded as female=0, and male=1. The negative impact of the MajorityGender feature therefore confirms the initial hypothesis that male borrowers have a harder time getting their predisbursed loan requests backfilled.
The feature with the most important negative impact across the whole feature set (including PostedMonth and topic features) is the loan amount: the more money is requested, the harder it is to get the loan fully funded. Assuming a constant allocatable sum per lender at a particular moment in time, it is logical that more lenders are required then to backfill a larger loan amount. If not enough lenders are found within the expiration period, the loan does not get fully funded.
Code organization for easy deployment
In order to facilitate deployment of the model in a live setting, and maximize code reuse, all relevant data preprocessing, feature creation (especially for SLDA), and feature scaling functionality was cleanly implemented in separate Python modules:
Finally, the best performing model was pickled and stored in GitHub. The main script that runs model training and evaluation is loan_funding_predictor.py. See the iPython notebook for its usage.
Step 3: Deployment of the predictor to the live back-end
| Technology | Used for | Useful for |
|---|---|---|
| GitHub | Storage of the best performing model | Lightweight deployment to the (until further notice transient) cloud environment |
| pickle | Deserialization of the trained model | Loading the trained model in the live web app |
| SLDA (Supervised Latent Dirichlet Allocation) | Inference of gamma values against a pre-trained auxiliary topic model | On-the-fly feature generation for previously unseen loan descriptions |
| Flask and Flask-RESTful | Setup of live RESTful web application | Serving on-the-fly predictions for previously unseen Kiva loan requests |
Deployment of the software and prediction model to the virtual machine at Digital Ocean was simply done by logging onto that machine, and pulling all relevant files from GitHub. The trained model itself was unpickled and loaded into a Flask-based web application. Obviously, the virtual box also includes preinstalled copies of Python, all required libraries (including sklearn), and a precompiled slda binary.
Step 4: Getting a loan page from Kiva
This step is simply a retrieval of a new loan page from the Kiva website. Kiva offers its lenders a constant stream of recently predisbursed loan requests from which to choose.
The following steps describe how we can — at least virtually — augment each loan page with live information from the loan funding predictor.
Step 5: Getting a prediction from the live back-end
Disclaimer: at the time of writing, and until further notice, the live environment is not meant to be running permanently. The backend will only be live during planned demonstrations.
A typical backend request-response cycle looks like this:
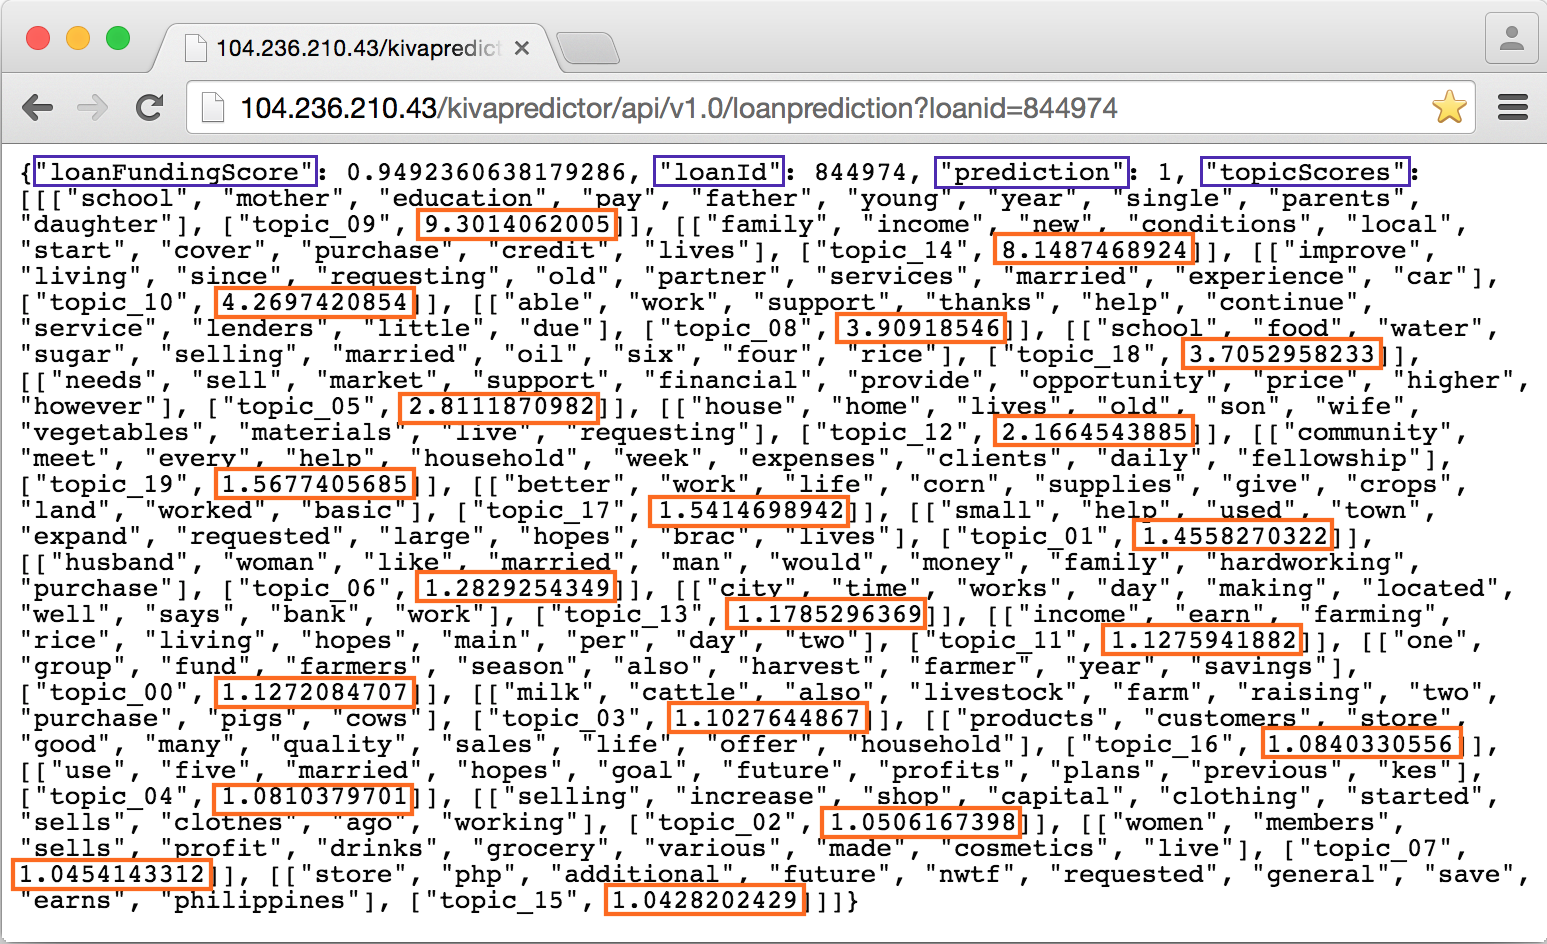
Each loan funding prediction response returns:
- the prediction: 0 (not fully funded) or 1 (fully funded)
- the loan funding score: a floating point number between 0 and 1
- the topic scores: a list of 20 topics for the loan description at hand, ranked by descending gamma value (prominence).
Again, each topic is represented by its 10 most prominent words. In isolation, the gamma values say nothing about the propensity of a given loan to get funded or not. As explained earlier, the polarity or direction of the relationship between each topic and the class label is captured in the logistic regression model. At prediction time, the loan document's gamma values serve as input to the logistic regression model. This prediction happens together with all the other features in one go, of course.
Step 6: Getting Kiva's information on a new loan
Before the predictor could send the abovementioned response, it obviously needed some loan information to work on. In the current architecture, the predictor web application itself reaches out to the Kiva REST API, to get all relevant loan information on the fly.
Step 4 revisited: visual integration in Google Chrome
To dynamically integrate the information received in step 5, I wrote a Google Chrome extension based on Kango and jQuery. Once it is installed and activated, the Kiva Loan Funding Visualization extension displays two new boxes inside any Kiva Loan page visited from that browser. It then looks like this:
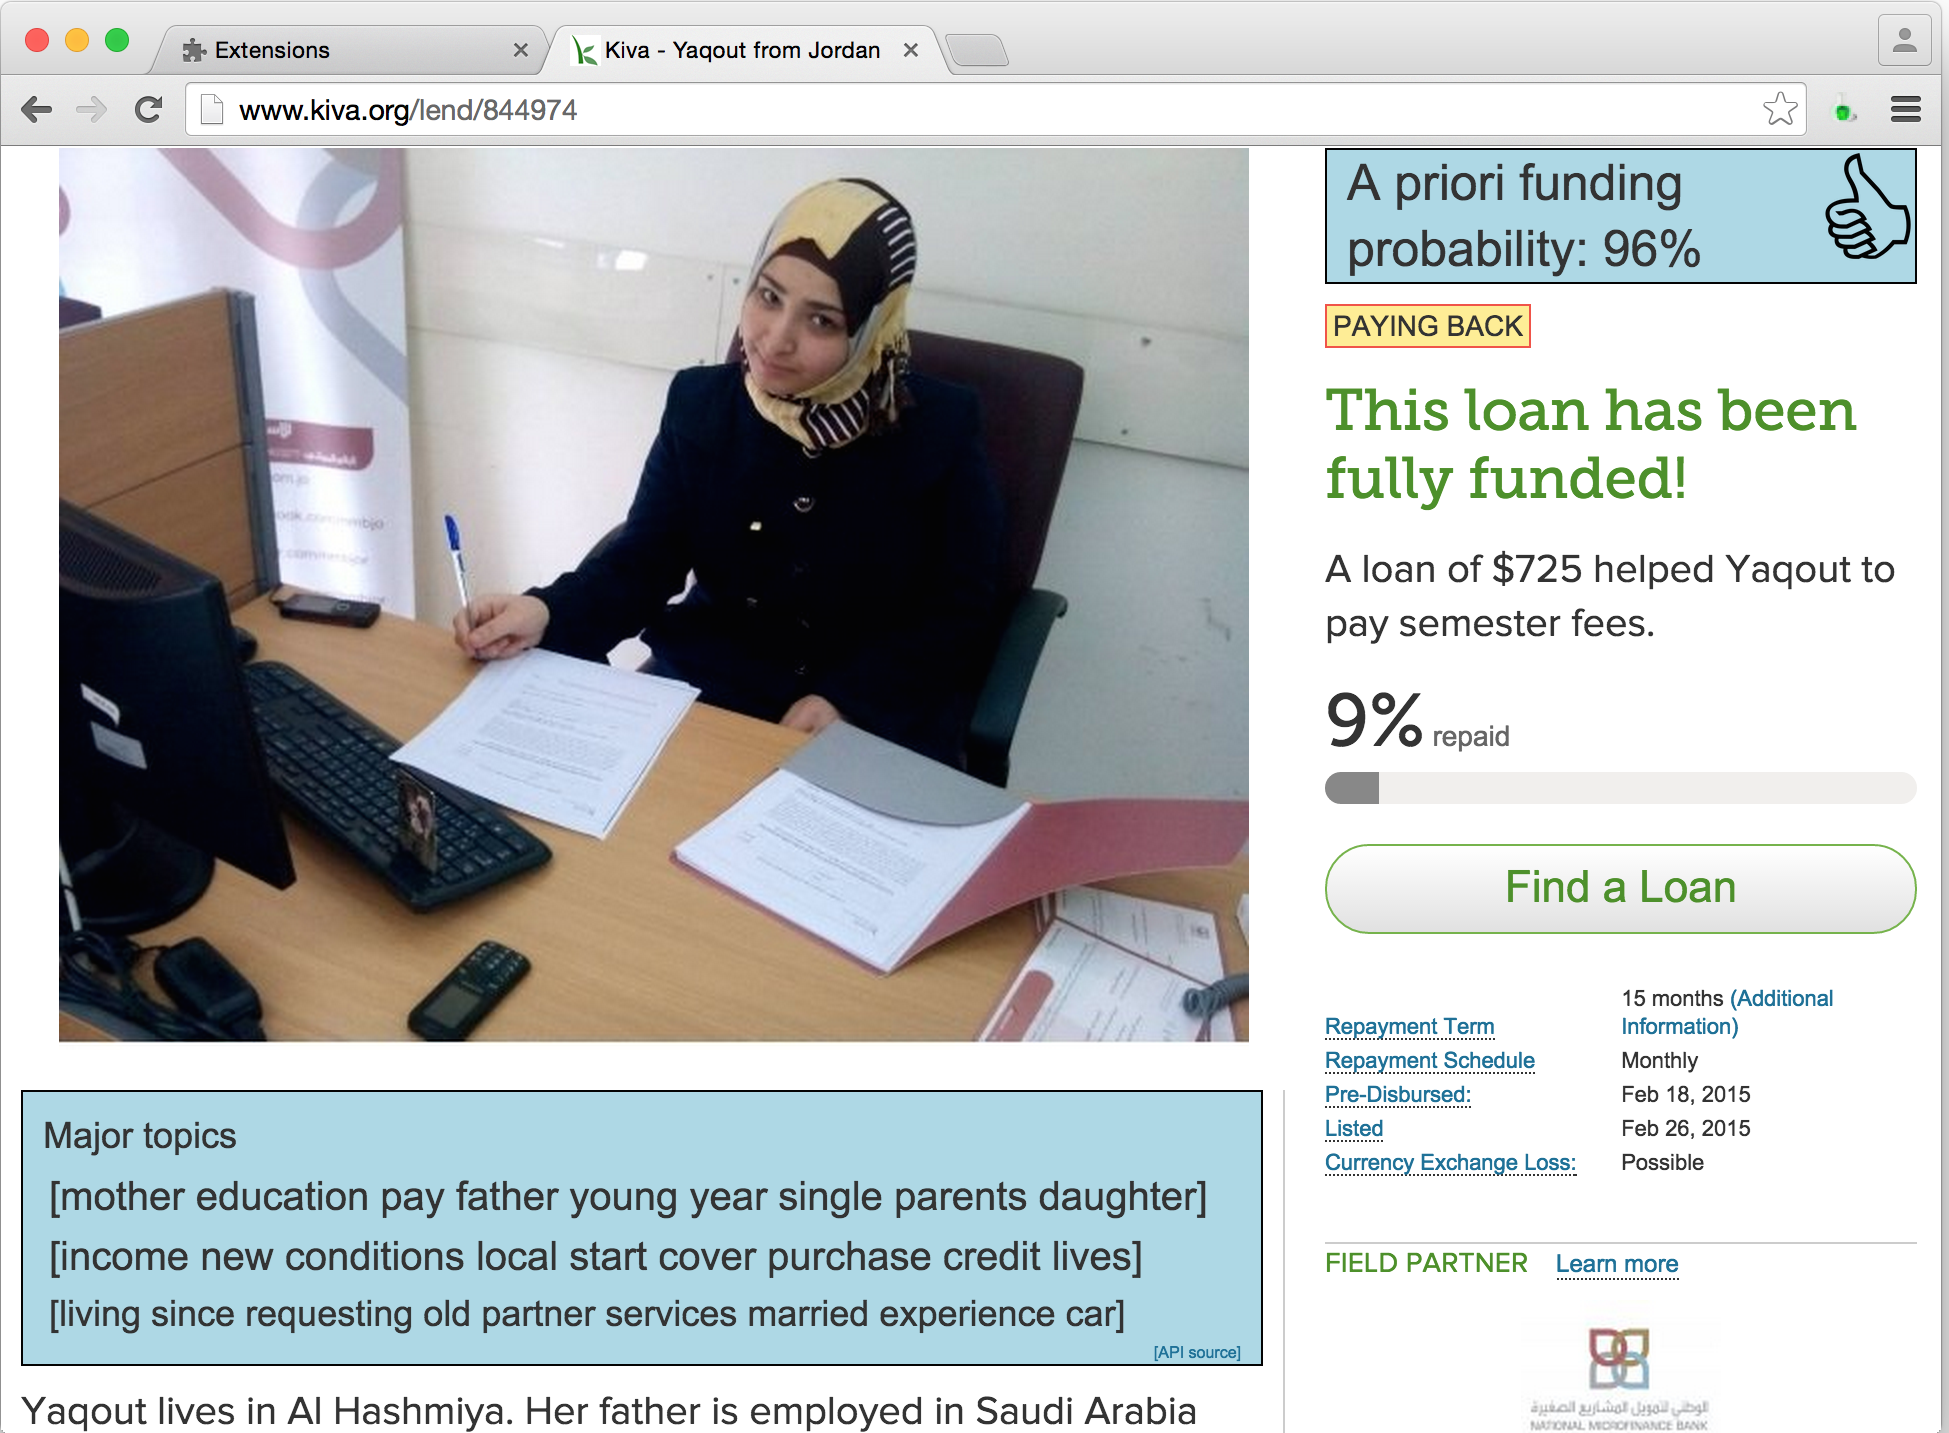
The box in the upper-right corner contains the prediction score expressed as a (rounded) percentage, and a thumbs up/down image that represents the binary prediction. The treshold is currently set at 50%. The probability is called a priori, to stress that the actual funding status (displayed by Kiva) does not play any role in the predicted value. In other words, the predictor would predict the same probability before, during or after the funding period - with one exception: the field partner features (e.g. LoansPosted), may have changed over time.
The box below the borrower's image contains the three most prominent topics for the loan (description) at hand.
Conclusion and further work
In this project, I have developed an end-to-end system that enables multiple actors in the Kiva ecosystem to get an a priori insight into the funding chances of previously unseen loans. While the current logistic regression model can no doubt be improved in various ways, its current performance of 87.82% ROC Area Under Curve is sufficient for a proof of concept.
As the virtual integration through a browser extension demonstrates, the system can indeed be deployed with minimum extra engineering effort, should Kiva wish to do so.
At the same time, the positive or negative contribution of each feature was identified. This may help Kiva actors in the field to adapt certain behaviours or revise certain decision strategies, should they feel the need to do so.
As far as deployment in the Kiva ecosystem is concerned, then, there will be more strategic and ethical questions to be answered, than technical ones.
Potential avenues for model performance improvement include:
- A more refined and tuned Supervised Latent Dirichlet Allocation model
- Different logistic regression settings
- Alternative estimators
- Additional and/or better features. I am especially interested in adding "trust" features detected from the borrower's image. The reason is simple: when I made my first Kiva loan in February, the image contents played a major role in my own choice.
Research papers on Kiva
- [1] Christina Jenq, Jessica Pan and Walter Theseira: What Do Donors Discriminate On? Evidence from Kiva.org
- [2]Jaegul Choo, Changhyun Lee, Daniel Lee, Hongyuan Zha and Haesun Park: Understanding and Promoting Micro-Finance Activities in Kiva.org
Acknowledgements
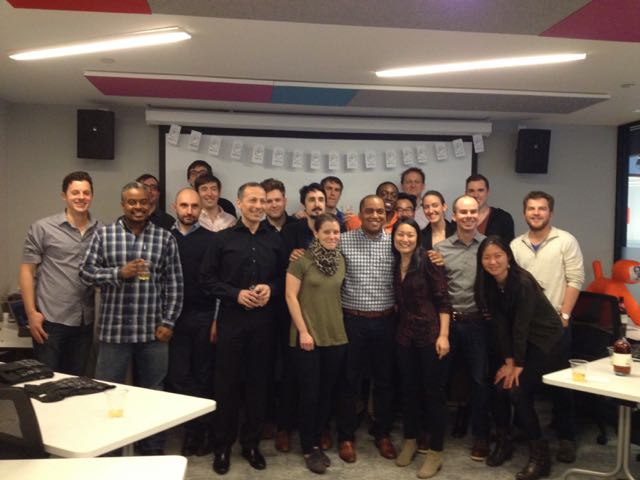
Having come at the end of this bootcamp in New York City, I would like to thank:
- my instructors Irmak Sirer, Bo Peng and Aaron Schumacher for having turned this Data Science Bootcamp into such an pleasant and rewarding experience. You guys rock!
- my Krash Brooklyn housemate and PhD candidate Marc Gerritzen for his valuable comments on an earlier version of this blog post, and, more generally, his interest in this project.
- all my fellow Metis Data Science students (Winter Cohort 2015), and my fellow Krashers in Brooklyn.
- my family and friends at home, for putting up with my three-month absence.
- the amazing and awesome city and people of New York, for their inspiration and energy.